Trading Strategy with Median Indicator - Steemit Crypto Academy |S6W4| - Homework Post for Professor @abdu.navi03 by @alihussain07
.png)
1-Explain your understanding with the median indicator.
In technical analysis trader uses the forecast where the they think the price of market may move. Through this analysis they can identify entry and exit point for any trading opportunities that their analysis highlights. This can be achieved by using trend analysis, by using different kinds of indicator and also by using different strategies such as support and resistance.
The most important thing while doing the trading is having knowledge about the prediction of upcoming trend and also to know about for how much time the trend will move in that direction. In other words we can say about the trend reversal. This problem can be solved by using median indicator which is trend based indicator and also gives information about the trend reversal. When we say that trend based indicator it means that it can predict the future trend in the market. One of its most important property which makes it different from other indicator is ATR (average true range)
ATR is one of the best market volatility indicator. The average true range indicator helps trader to understand the way by which cryptocurrency moves. The main idea behind true range strategy is we only want to trade when market os ready to accelerate and if we identify how much the price moves on average this can helpful to achieve consistency in trading. In case of median indicator these channels are present above and below the candles representing the price movement.
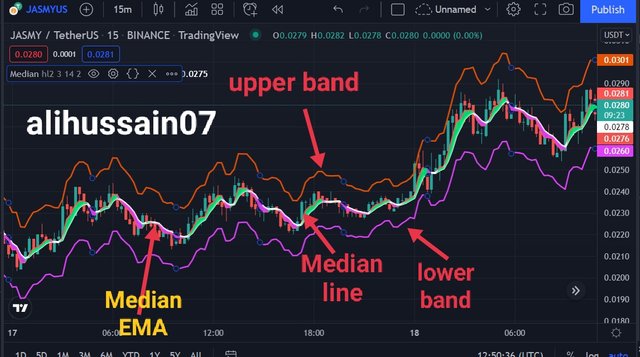
While using the median indicator there are two colors are mostly present in this indicator which are green and purple. When there is green color on the price movement chart than it means that market is going up and there is bullish trend in the market. While on the other hand if there is purple line upon the price action than there will be bearish signal in the market.
When can predict the market trend with the help of median line and EMA line using in combined way. Here we can use cross over strategy , when Median line pas from the EMA line and start moving upward this will be the indication of bullish trend, and there will be green of the line. While when Median indicator line cross below the EMA line it will turns purple and there will be bearish trend in the market.
2-Parameters and Calculations of Median indicator. (Screenshot required)
When we are making calculation with the help of indicator there are some basic information is necessary to understand. In case of Median indicator there are three terms that are needed to be understand.
- ATR(Average True Range)
- ATR Multiplier
- Median length
There are two bands present in the Median indicator that upper band and lower band. The above 3 terms are used to calculate the upper and lower band of the median indicator. Median length line is present between the upper band and lower band while upper band is pres at Median length+2ATR while lower band is present at Median length- 2ATR.
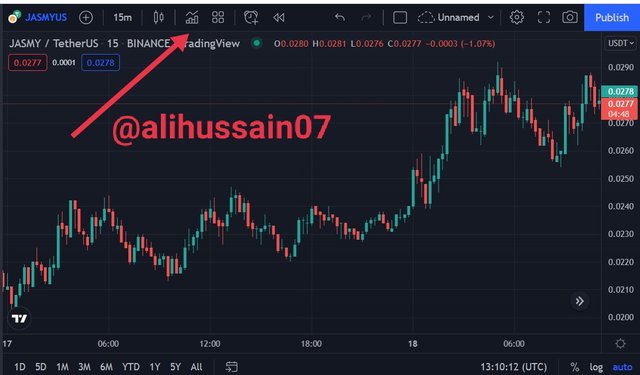
In order to apply the Median indicator on the chart following instructions can be followed. Just click on the option that is mentioned with arrows.
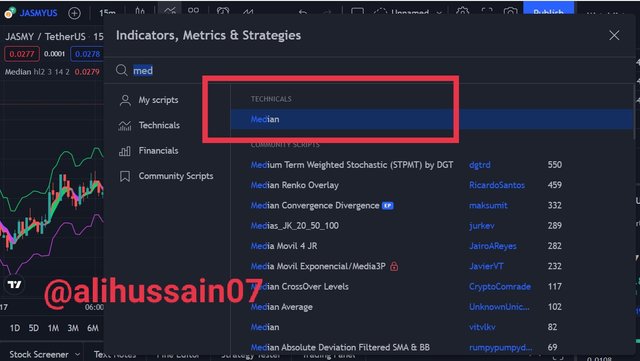
In the next option go for searching Median and here you can see that after clicking on this indicator is applied on the price chart.
Here we can go for modification of the our indicator. You can see that there is median source that is hl2 Median length which is default is 3 ATR Length is 14 and ATR Multiplier is 2. These all are default settings and we can change them according to our trading setup.
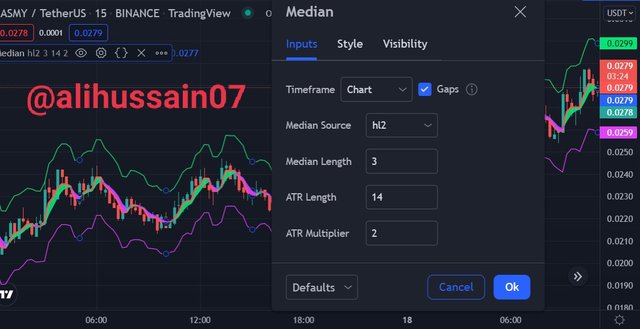
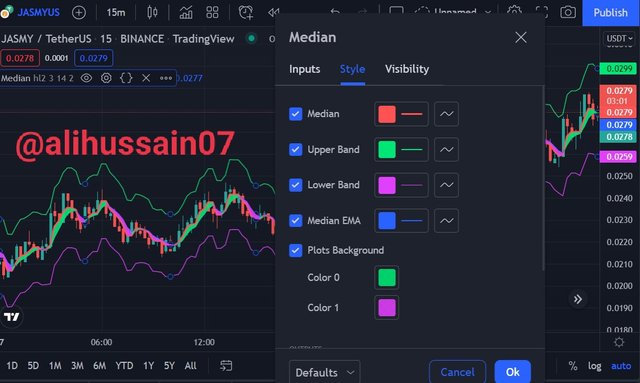
Here we can change the color and width of the line from the below window which you can see in the screenshot.
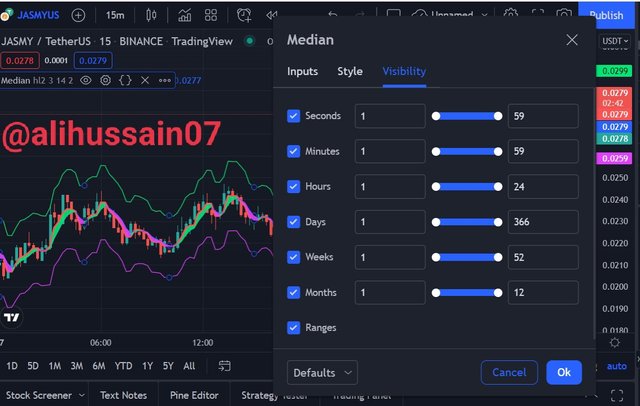
And from this we can see the visibility of different timeframe and this can also be changed.
3-Uptrend from Median indicator (screenshot required)
There are Median line , median EMA line and also the color of the cloud which can be used to predict the trend in the market. Median indicator is a trend based indicator which can be used for predicting the trend in the market. In order to predict the bullish trend in the market
- When the median indicator line crosses the Median EMA line and start moving upward from EMA and the color of the cloud turns green this will be the indication of the bullish trend in the market.
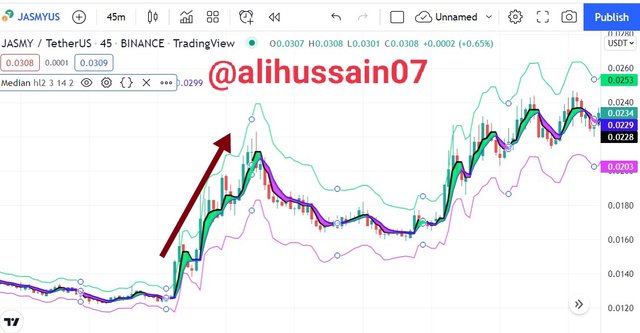
In the above screenshot you can see that here Median line is indicated with black line and EMA line is represented with blue color. You can see that Black line which is of median is making cross over and moving above the EMA and also the color of the cloud is green all this indicator of bullish trend in the market.
4-Downtrend from Median Indicator (screenshot required)
Bearish trend occurs when market is going in downtrend and this can be confirmed with using above strategy of using median indicator line, EMA line and color of the cloud. When Median line cross the Median EMA line and moves below the EMA line and the color of the cloud turn to purple. This is the indication of bearish trend in the market.
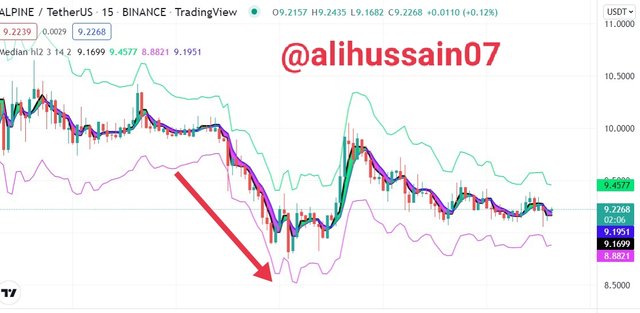
In the above screenshot the median line which is in black color is moving downward from EMA line and color of the cloud os also purple which is the indication of bearish trend.
5-Identifying fake Signals with Median indicator(screenshot required)
As we know that indicator just indicate the market trends not 100 % confirm the trend. We can use multiple trend in combination to confirm the market trends. If we used single indicator it may gives the false signal due to having less information and high volatility of the crypto market. Here we can also use different indicator in order to filter the false signals.
So here I will use Relative strength index indicator which is consist of single line that moves below the chart. When the value of RSI is at 30 it means that it is oversold region and its time to enter the market as buy long and when the value of RSI is 70 means that its time to go for sell short because it is overbought region.
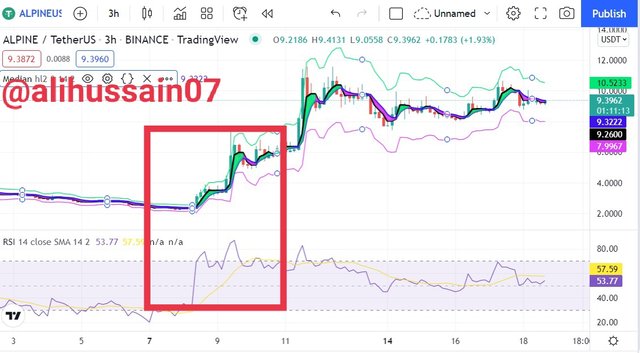
In the above screenshot you can see that when the value of RSI is at 70 but the trend is not reversed. It reverse at almost value of 86 . So in this way it was a false signal. So in this way combination of indicator can be used to filter the false signal.
6-Open two demo trades, long and short, with the help of a median indicator or combination that includes a median indicator (screenshot required)
As we have mentioned all the necessary information about the bullish, bearish trends. Here we will do a demo trade in order to apply all that information that we have learned above.
As we know that when there is bullish trend in the market means that median indicator line cross and moves above the EMA line and the color of the cloud is also green.
In the below screenshot you can see that the black Median indicator line is above the EMA line and also the color of the clod is also green which indicates the bullish trend in the market.
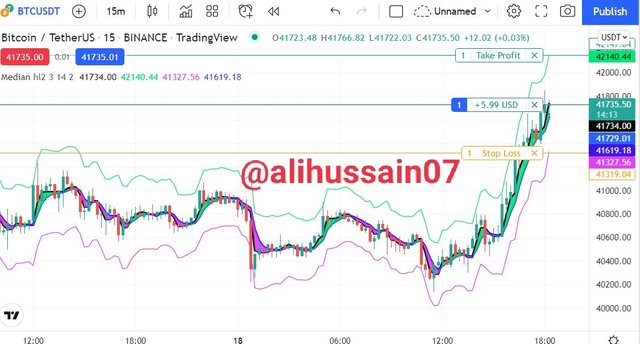
After analyzing the market by using my knowledge that I learned from this lecture I take my trade as buy long by trading view as demo account.
After that according to the requirements now I will do a sell trade by using the above knowledge.
Here you can see that there is perfect condition to go for sell short. As you can see that Black line of median line is below the EMA line and also the color of the Cloud is also purple which also indicate to enter the market as sell short
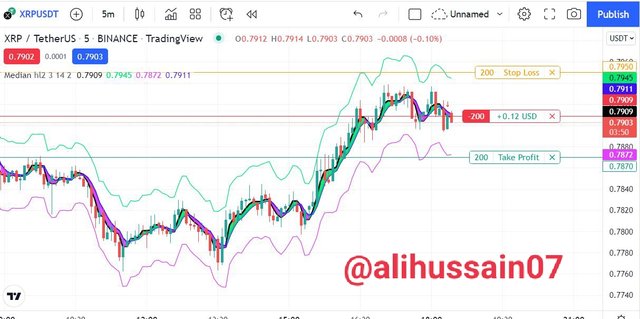
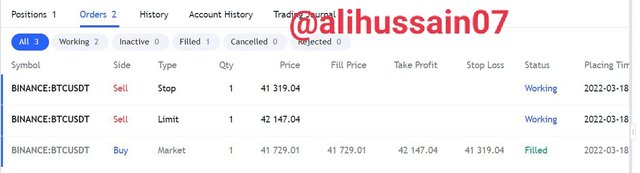
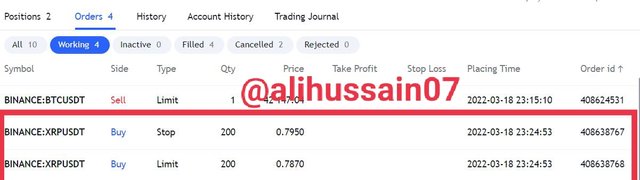
So after analyzing the market I go for sell short and also put my stop loss and take profit zone as you can see in both trades.
Conclusion
Technical analysis are the real backbone of the crypto trading. You can make huge profit by following combinations of indicator. Median indicator is a trend base indicator that can be used in order to predict the market trends. This is the combination of EMA indicator and also with median indicator line. There is also ATR channel is present in this indicator. These are represented by cloud pf different colors. For example when there is bullish trend in the market then color of the cloud is green and when there is bearish trend then color of the cloud is purple. In the last section we do a demo trade in both long and short position.
Cc
@abdu.navi03
