Crypto Academy / S4W5 - Homework Post for [@allbert] - A/D LINE INDICATOR
hello crypto prof @allbert
i am please to be taking part of this weeks crypto academy i have been a off for while due to a computer problem , but it been resolve so i am back on track , let me say that i appreciate your lesson this week and i have learnt something new about this indicator so using togethere with other indoiicators will give me perfect solutions.
Explain in your own words what the A/D Indicator is and how and why it relates to volume.
This was an indicator developed by an experienced indicator developer Mark Chaikin also the developer of chaikin oscillator.
This indicator Is basically used to measure the flow of money in and out of the market represented on a trading platform using an oscillation line that tells a trader if an asset is overbought meaning more money is invested or oversold.
The A/D simple means Accumulation and distribution and this terms implies that, when most traders are investing money hence the market volume will increase on the other hand distribution comes in when the assets is been sold much.
Sometimes the A/D indicator also help traders identify change in trends, such that the price volume moves in opposite direction to the A/D indicator.
So basically this indicator us identify strong and exhausted trends and also changes in trends.
Practically when a market is accumulated this is what the indicator will show:
.png)
And when the accumulated volume is distributed we have this:
.png)
Through some platforms, show the process of how to place the A/D Indicator
- First of all open your trading platform and select a pair you want to trade on , in my case I chose DODGE/USDT
- On the trading platform click on the indicator button and search for A/D Indicator kindly click on it and it will be launched instantly.
.png)
- After it been launch one can change some little settings and format the appearance of the AD lines
.png)
Explain through an example the formula of the A/D Indicator.
To answer this question we will be considering three factors which are: the multiplier of money flow, the money flow volume and finally we will calculate for the accumulation distribution line.
To get the formula of A/D can be obtain form the following steps:
First of we have to calculate the close and low prices , subtract the close price from the high price as well
Next we have to subtract the two results and divide the answer you get by the highest low
Next is the calculation of the money flow volume which is done by multiplying the Money flow multiplier above by the volume of the period
To calculate the AD line we just have to add up the A/D line of the previous period to the new obtain money flow volume , this tells us the reason why the A/D line is denoted to be +1 or -1
After the above calculation we have the formula below:
.png)
From the above formula let try some example , let say the low price of the current period is $344 an the close price is $370 ,the period also recorded a high price of $360 with a Money Flow Volume of $50,000 and assuming the previous A/D line recorded 170,000
From the data provided we will have:
MFM =((370-344)-(360-350))/(360-344)
MFM= - $1
Money Flow Volume = MFM X Period Volume
MFV = 1 X 50000
MFV = - $50,000
AD LINE = CURRENT MFV + PREVIOUS AD-LINE
AD LINE = 50,000+50000
AD LINE = 100,000
How is it possible to detect and confirm a trend through the A/D indicator?
As we all know from experience from crypto trading, indicators are not perfect but using them carefully in collaboration with other indicators will help predict perfect trends.
The A/D indicator helps a trader to identify the money flow in an assets and the money flow out of an assets basically I will say the demand supply of that asset.
The movement of the A/D line helps to tell in which trend the market is heading towards, it also tells either the trend is weak or strong.
The main idea behind this indicator is to tell traders to buy which is the Accumulation face usually the AD-LINE moves in the same direction with the market trend upwards and when the trends diverges from the market trends it tells traders to exit the market because the Distribution phase is about to commence.
This Indicator can be perfectly used when there is trending chart, using it in a consolidating chart will give you wrong interpretations.
So basically we read A/D-LINE as follows:
- When the line is moving higher as shown below it tells you to buy :
.png)
- When the line is moving lower it is an indication to exit the market
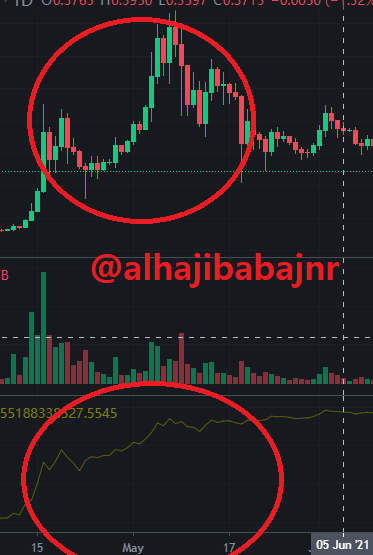
In some cases there is a divergence indicating either an exhausted bullish or bearish trend, when the A/D-line moves in a direction opposite to the upward trend it is an indication of the trend changing to downwards and other hands it will means the opposite.
Few examples below:
.png)
Through a DEMO account, perform one trading operation (BUY or SELL) using the A/D Indicator only.
In this context I will be using the EURO/USD forex pair in META TRADER 5 , after opening the chart the AD line was showing a signal for going short , I carefully observed how this could be true so I had to use a second indicator to confirm the trend before entering the market.
So I added the Moving average which was also indicating a down trend as shown below:
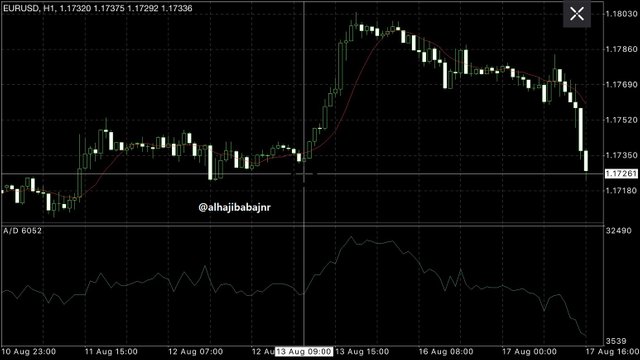
So I used my demo account to go short for this particular pair
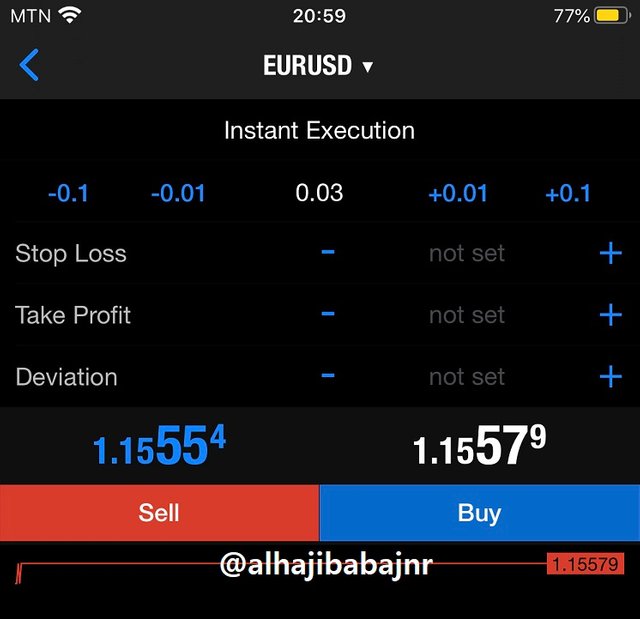
Finally the trade is been executed.
What other indicator can be used in conjunction with the A/D Indicator. Justify, explain and test.
In my case I have always preferred the super trend indicator as a backup or a verifier to signals of other indicators, from the chart below I open both the A/D Indicator and the Super trend indicator let observe their movements.
.png)
From the image above we can clearly see that the A/D indicator is showing the commencement of a new down trend and the Supertrend is also showing a red line to confirm the downtrend.
Using this two indicators a trader can be a much assured of a correct signal though indicators in trading are all not what we have to focus on , because they are not perfect they give false indication some times
finally let thank the entire steemit team for powering such a great platform for us to learn and have experiences of the crypto trading.