Crypto Trading with Moving Average -Steemit Crypto Academy | S6W2 | Homework Post for @shemul21
Hello everyone hope you all are fine and safe. Today i attend one more lecture by @shemul21 in which i learn about the Moving Average indicator. How to make trade by using this indicator and many more. Now i am going to submit my homework post for this lecture: so let's start;
Explain Your Understanding of Moving Average.
For successfull trading trader should have enough knowledge regarding the market , the assets and technical knowledge. For knowing the situation of market and trends trader's use indicators. Indicators provide knowledge about the trends in market and many more. In crypto market there are lot of indicators like MACD, RSI, moving average and many more. Always use two or more indicators in combine to get good results.
Moving Average indicator is vary popular indicator , lot of traders use this because it is vary easy to understand. Moving Average indicator is used to find the direction of trend. Moving Average indicator is used to find out the support and resistance levels in the market. Moving Average indicator provides the entry and exit point signals. Moving Average indicator filters out noise in the market by eliminating minor price moments this helps traders to better visualization of market and trader easy understands the market.
Moving Average indicator is calculated by using the mathematical concept Average. Which is sum of numbers to the total number of quantities. In moving Average it sums the price of assets at different periods and divide it by total periods . The result is provided in the shape of graph represented by a line. So moving Average indicator gives us the information regarding the past price action of market and that is used to predict the further price movement.
In moving average indicator trader can choose the period according to his own understanding . in moving Average indicator there are lot of time periods available such as 15days, 20 days, and upto 200 days. Moving average is a lagging or we can say it is a trend following indicator as it is based on past prices. Lagging and time period varies directly proportional to each other. If we use high period grater will be the lagging. 200 days moving average will have more lagging than 15 days moving average.
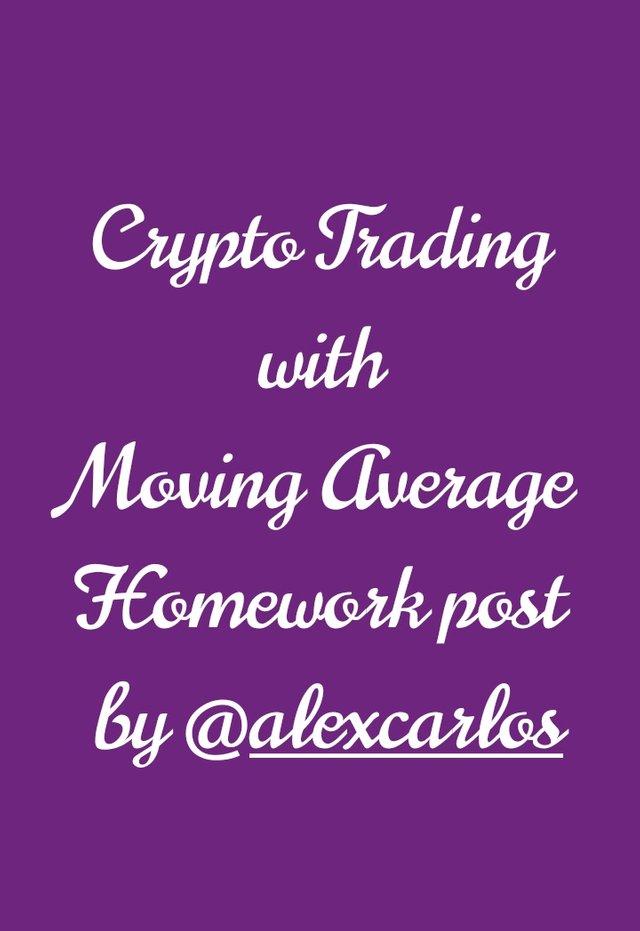
Image source trading view
Look at the above picture which i take on trading view. I have added 20 period moving average. You can clearly see moving average indicator tells us that price is moving in the downward direction . As it filters out the noise from the market. It tells us downtrend as price moves below the moving average line. We can use this indicator for entry and exit strategy.
What Are The Different Types of Moving Average? Differentiate Between Them.
There are various types of moving Averages present in the market. These moving averages work similarly but have little bit difference in taking the data points and have different mathematical formula for calculations. Different moving averages came into existence in order to remove the lagging problem. I will talk about three famous moving averages in my homework they are given below in detail:
1.Simple Moving Average
Simple moving average is the simplest type of moving average. Simple moving average is calculated by the simple arithmetic mean of prices at different periods or simple moving average is calculated by adding the prices of assets at different periods and divided it by total number of periods. If you need to get SMA of 10 days we have to add the closing prices of each day and divide it by 10 days. The difference between the moving average and simple moving average is that in SMA as soon as new data is generated the oldest data is disregared. SMA is used to find the entry and exit points in market as well as to find out the support and resistance of a asset.
Formula for calculating SMA is given below
SMA = A1+A2+A3+.................An/n
Where A1,A2,A3,...,An are prices at different periods
N is the total number of periods
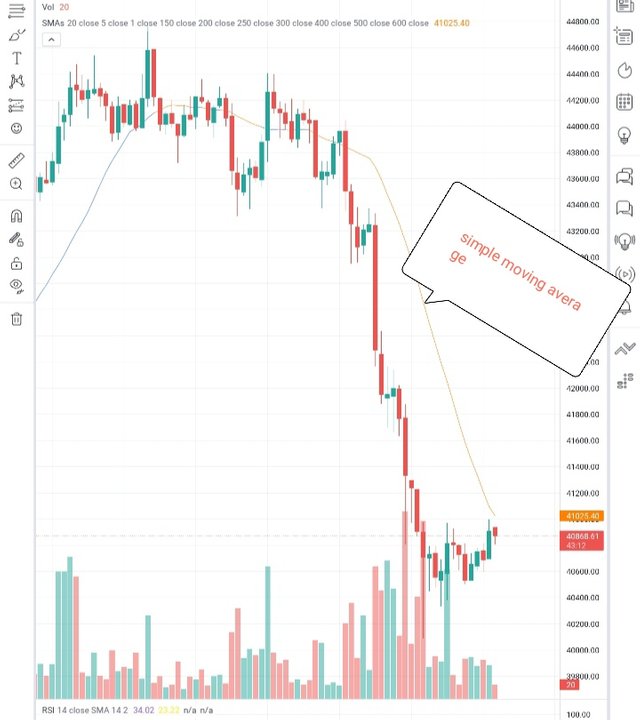
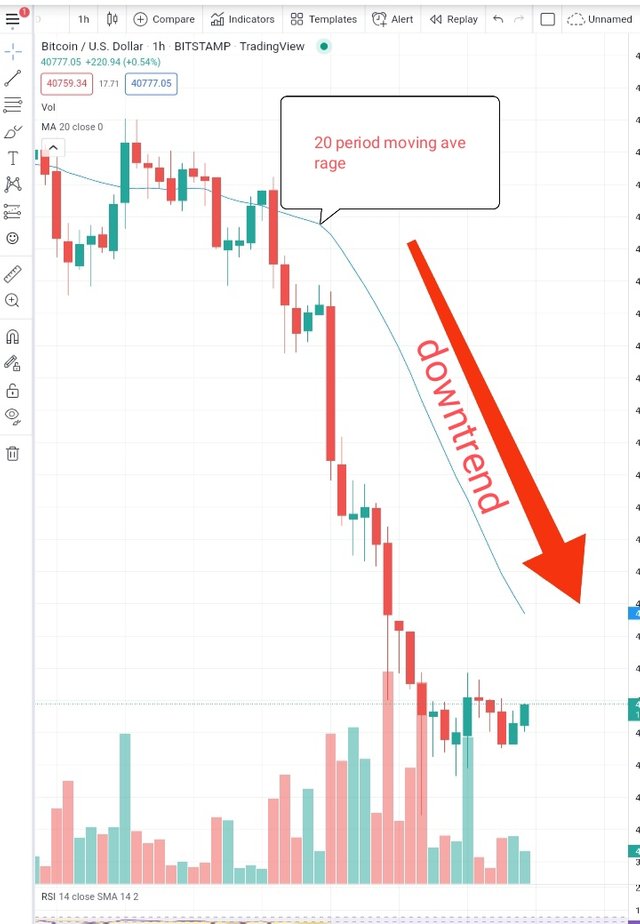
Image source: trading view
You can see i have added simple moving average to btc-usdt chart. By SMA we can easily understand the trends in market.
Exponential moving Average
Exponential moving Average gives more weight to the most recent prices this makes this indicator more responsive to the new information or new prices. SMA and EMA have little bit difference that SMA applies equal weight to all the price changes in the given period where as EMA applies more weigh to recent price change. Exponential moving average revolves the lagging problem to grater extent. Trader can use both of them in combination for better results in short and long time frames. Below is the formula for calculating the EMA:
EMA today = {Pt × (s/ 1+d) } + EMA yesterday × {1- (s /1+d) }
Where
Pt is price today
S is smoothing
d is number of days
Image source: trading view
You can see i have added EMA to tlm-usdt chart. By EMA trader can easy understand the market trends.
3.Weighed Moving Averages
Weighed moving average is another type of Moving averages that lot of traders use it for buy and sell signals and for finding the trend in the market. WMA gives more weigh to the recent data points than the previous data points. Whe. The price is moves above Weighed average it is uptrend and when it moves below Weighed average it is down trend. WMA reacts faster to the price change and gives signals more fast than the above two. Below is the formula for calculating WMA:
WMA = {price1 × n + price2 × (n-1) + price n} / [n × (n + 1) / 2]
Wher n is number of days
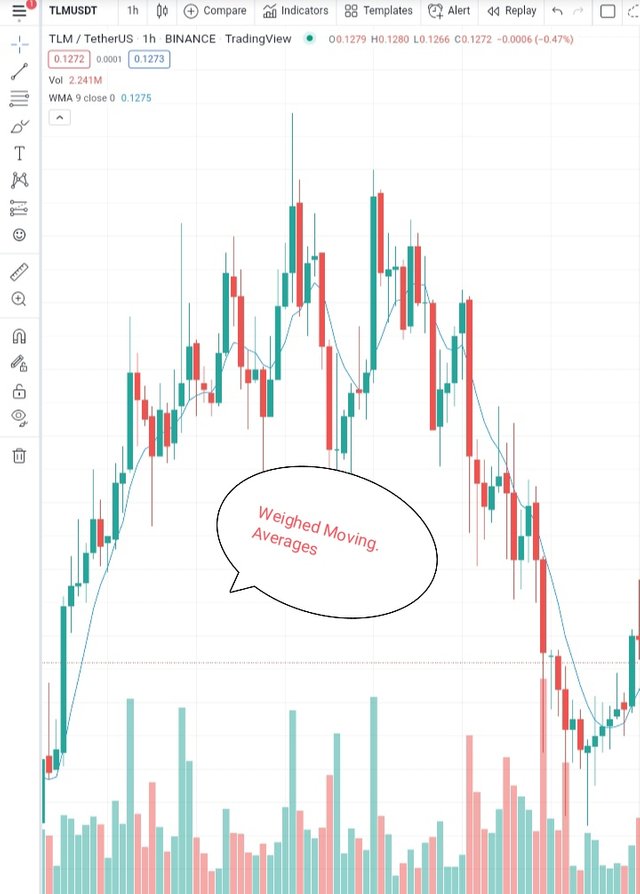
Image source: trading view
You can see from the above i have added WMA. By using this trader can easily find the market trend and get signals faster as easily.
Now let's talk about some differences between each moving averages:
Simple Moving average weighs all the data with equal importance while Weighed moving averages gives more concentration on recent data points and EMA gives concentration on present data and smooths out the price by multiplying factor.
SMA has less speed , WMA has medium speed and EMA has high speed.
SMA is good as long term indicator, EMA Is good as short term indicator and WMA is good as both short and long term indicator.
SMA is better for long term trading, EMA is better for short term trading and WMA is better for both.
SMA is lagging indicator , WMA is more sensitive even for small changes and EMA reaches vary faster towards the price.
Identify Entry and Exit Points Using Moving Average. (Demonstrate with Screenshots)
Moving average indicator provides entry and exists points in two ways one using only one moving average line and another using two or more moving averages in combine having different periods:
In the first method we have to look on the Crossover between the moving average line and the price line. The Crossover between moving average line and price helps us to find entry and exit points depending upon how Crossover takes place.when the moving average line moves below the price it gives us buy sign after that price of asset will move in upward direction. When the moving average line moves above the price line it gives us sell signal or exit point or it tells us bearish trend is coming so trader should have to exit from his trade. Let's understand it by two examples:
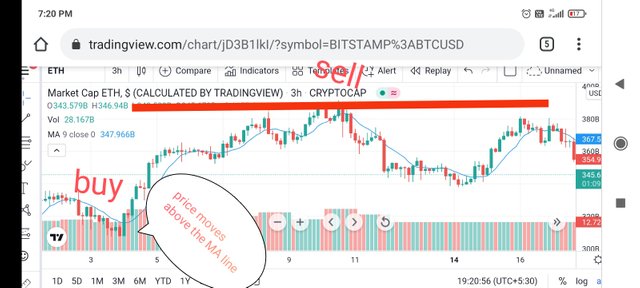
Image source: trading view
From the above eth chart you can see buy entry is taken when price line crosses the MA line and moves above it. Trader can sell or exit from the trade when the price touches the resistance level which i have shown in the picture.
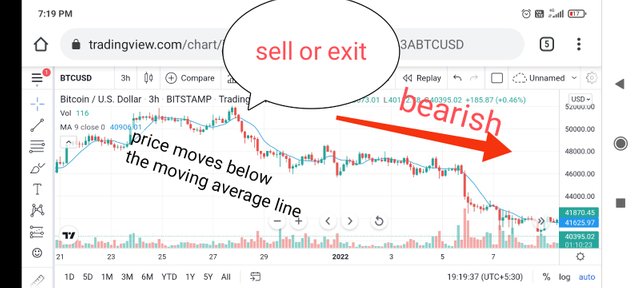
Image source: trading view
Now look at the above chart of btc-usdt sell entry or exit from the market is done when the price line crosses the MA line and moves below MA line. Here trader can put short entry also. Trader can make entry in the market once again when the trend changes or when price touches the support level.
Another method of finding the entry and exit points is by using two moving averages in the chart one longer moving average and one shorter moving average . When the shorter MA crosses above the longer MA it is buy point after that price will move up. When the shorter MA crosses below the longer MA it is sell point after that price will go in downward direction. Lets understand it by using examples:
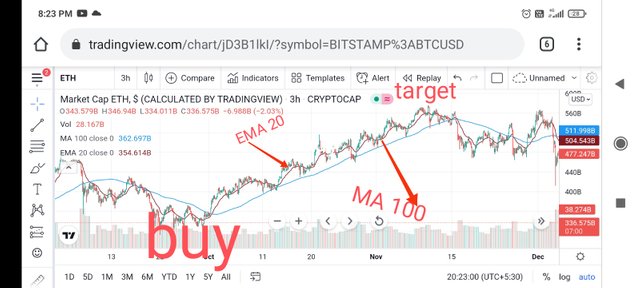
Image source: trading view
I have used 20 period EMA and 100 period MA. I have taken the entry at the Crossover point when the 20 EMA moves above the 100 MA line. After that market will go up. I have set a target at the resistance level.
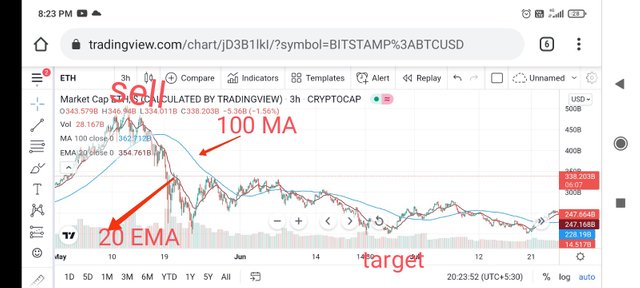
Image source: trading view
I have taken used 100 MA and 20 EMA for sell entry. I put sell order at Crossover point between these two lines and the 20 EMA line moves below the 100 MA line. After that market goes in downward direction. I have set the target point at the support level. After that market will move back to upward.
What do you understand by Crossover? Explain in Your Own Words.
Moving average Crossover is a technical tool which is used by traders to find out the entry and exit points in the market and also gives us the information regarding the market trends. Moving average Crossover occurs when two different moving average lines crosses one another at a point. When the Crossover occurs it tells us that the trend will reverse after that.
For the Crossover we need two moving averages one faster and another slower moving average. When the faster moving average crosses the slower moving average and moves above it we get bearish reversal in the market. Soon we will see bullish movement in the market. So here you can make buy entry and make good profits. Also when the faster moving averages crosses the slower moving average and moves below it we get bullish reversal in the market soon we will see bearish moment in the market. Here you can make a sell entry and make profits.
For this i have used faster 20 EMA and slower 100 MA
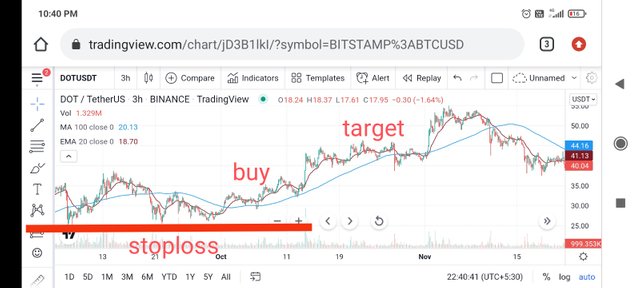
Image source: trading view
You can see from the above example of dot-usdt when faster 20 EMA crosses above the slower 100 MA line it tells us bearish reversal trend. Here you can make a long or buy entry .
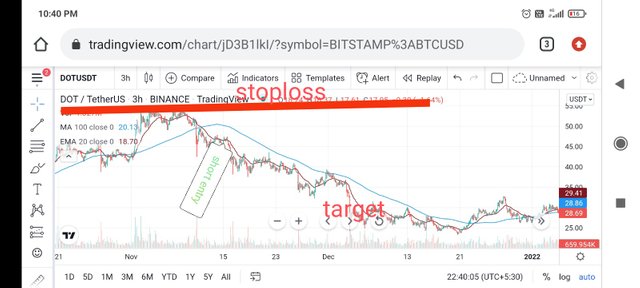
Image source: trading view
Now look at the above example of dot - usdt here faster 20EMA Line crosses below the slower 100 MA line which tells us bullish reversal trend. Soon market will go in downward direction. Here trader can make a short trade and close his position at the support point.
Explain The Limitations of Moving Average.
As we all know everything in this universe is not 100% efficient. Same is with moving average indicator although it provides good signals but sometimes it may give wrong signals . so always you two or more indicators in combine in order to filter out the wrong signals and make good trading signals. Below are some limitations of Moving average indicator:
During the sideway market moving average didn't provide any proper information regarding the price movement.
Moving average indicator is a lagging indicator that my lead trader to miss some good opportunities in the market.
In the cyclical pattern when market is bouncing up and down a lot Moving average didn't tell about the trends at that time.
Sometimes the Moving average indicator provides different trends in different time period used.
Moving Average draw trends by using past prices only. It doesn't provide anh information regarding other factors that may affect the assets performance or price.
Conclusion.
Moving Average indicator is basic indicator used by lot of traders for finding the trends in the market. Moving Average is calculated by using the past prices. Moving Average is lagging indicator so trader may sometimes miss some big opportunities in the market. Also Moving Average didn't provide proper information in the sideway market's . So it is best to use this indicator in combination with other indicators in order to get better signals and filter out the wrong signals.
THANKS