Chart Basics 101, The EMA 8-the Trend Line

Looking at today's chart for Bitcoin, we can see that it is moving in the right direction again. We see upward movement and we love that. But what else does the chart tell us?
When I began studying charts, I spent money on a guy that has a training deal online. It was not expensive and I did learn something from him. The technical reading was never taught, although he said we would know how, he did however, teach a valuable lesson. No matter how well you can read a chart, you need one thing. One thing that is more important that analysis. One thing that will either make you a success or a failure in trading. Emotion. You need to keep your emotions in check.
I am not a financial advisor but just someone who wants to help. Knowing how the trends flow and the charts work, you can have more control of your investment. Success is managing your own emotions and being able to read the chart to see the emotions of the other traders. Along with some technical tools in the chart, you will be able to see how this all comes together.
Today, let's look at the EMA 8 or Exponential Moving Average. It differs from the SMA, Standard Moving Average. I like using the EMA 8 and paying close attention to that trend indicator because it tells you exactly what is happening and what is going to happen.
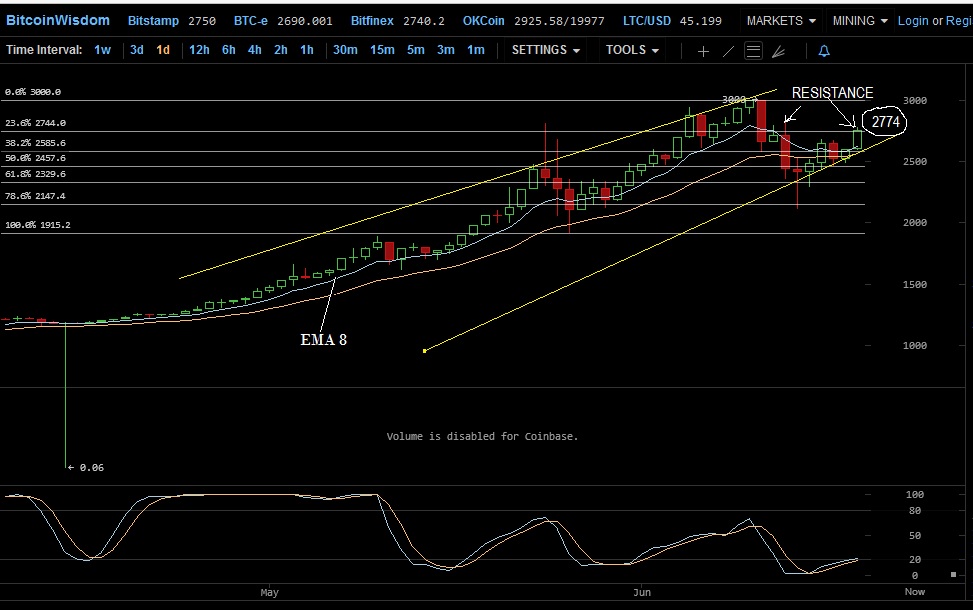
The chart above shows today's Bitcoin movement. It is the 1 day chart meaning each candle represents 1 day of trading. We see it green in color meaning it was a positive gaining day. Red is a negative losing day. The key is looking at the EMA 8 which is the top line here almost bluish in color above the yellow line. You will see the candles have been riding above the EMA 8 signifying a positive trend for the last couple of months. As long as the candles ar above the EMA 8, it will continue to move in an upward trend. Once the candles fall below the EMA 8 then it shows a reversal or a pull back is happening.
The key here: the candle has to finish above the EMA 8 to still be on the upward trend. We see that once it hit 3000 8 days ago on the chart, the next day we had a huge red candle finishing below the EMA 8. Looked like a big sell off and people taking profits. Nothing to worry about that is normal. That is what we do. The next day had a small green candle but finished below the EMA 8. The 3 next days all fished under the EMA 8 which tells us not to jump in yet because we do not have confirmation that the pullback is done and the bulls are stepping back in. We did have a finish over the EMA 8 which would have been a signal to buy back in or purchase more coin. Key: Confirmation may need more than just one day to be sure. Head fakes happen all the time. Remember we are dealing with emotional people in these markets. 2 days ago it closed above the EMA 8 and likewise today continuing the upward trend.
The horizontal lines across the chart are called Fibonacci Retracement and we will discuss that later. I also like to use the full Stochastics which are the lines below the chart. Again, as we move ahead I will be explaining these indicators as we go. I like to keep things very basic and minimal. During my learning, I had so much technical junk running through my head I could not make a trade properly. I was killing myself with every possible scenario that could happen and once I had what I thought was the right trade, a bunch of emotional traders would sell off on fear and negate all the technical analysis I spent hours figuring out. Emotion is the name of the game. Contain yours and watch the charts to see other's emotions and trade accordingly.
Being the first post on charts, I hope this simple information may help you. We are just starting up here and I will continue to post more as I have the time to. I look forward in meeting new friends here and opening up correspondence so we can all help each other manage our portfolios and emotions to be successful!
All the Best!