Chart Basics 101 Part 3. The EMA 8-The Trendline, Resistance and Support Lines
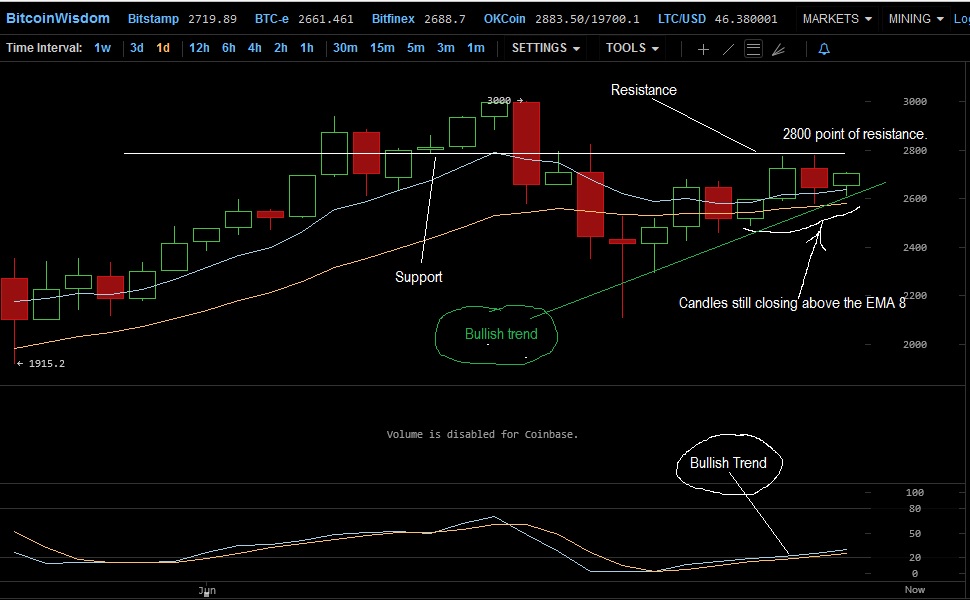
The bulls are still hanging in there. Even though we saw a red candle the other day, we can still see that is did not close below the EMA 8 telling us that the bullish trend was still in tact.
This is just my opinion on what is happening in this market and should not be taken as financial advice but just a platform for discussion.
Another key characteristic of the EMA 8 that can help you track your stock or crypto is how far the candle moves away from the EMA 8 both up or down. Remember that the candle will always come back to the EMA 8. When you see a trend where the candles begin to pull away from the EMA 8 this is your signal to be prepared for either a pullback or a breakout. Either way a reversal is about to happen.
Looking at today's chart as of 830 Pacific time, we see that yesterday's red candle did not fall below the EMA 8 and did not signify a reversal to the bullish trend that started 4 days ago. We can also look at the Stochastic below and see that the upward trend is still intact with the light blue line above the yellow. These two indicators will show you what is happening and what the general emotion of the traders are feeling. As I said yesterday, the majority of traders or people buying into BTC do not know how charts work and trade on emotion. They buy too late chasing and sell too late loosing. Frustration begins to cripple them into more fear, worry and panic. A trader motivated by these traits will soon part with his money.
We saw a few days ago that the BTC was having trouble crossing the 2800 mark which now is the resistance. I believe around June 7 that same 2800 mark was support on that little run we had. If you go back around that time frame we can see what happened. The candle had moved away from the EMA 8 but not too far reaching 3000 causing many to sell and take profit the following day. On the Stochastic we can see the bullish trend line start to dip the last day of the green candle before the sell of. This is your trigger to get ready to sell. As most successful traders saw this coming they got out and took profits. The rest were bag holders holding on for dear life as the price tanked. In hopes of a correction they kept on holding until fear gripped them so much that they finally sold off when it was too late. At this point the successful traders saw this and knew it was time to get back in.
Knowing some basics of charts can improve your position and allow you to make better and more calculated moves. I have lost so much in the market on account of my ignorance which then prompted me to learn charts. Even after learning the basics I could not contain my emotions and still made bad trades. Charts and emotions are the name of the game. Learn the charts and learn how to develop a plan and stick to it no matter what and you will have a better chance in being Mr. Successful trader dude!
All the BEST!
Congratulations @alethinos! You have completed some achievement on Steemit and have been rewarded with new badge(s) :
Click on any badge to view your own Board of Honnor on SteemitBoard.
For more information about SteemitBoard, click here
If you no longer want to receive notifications, reply to this comment with the word
STOPBy upvoting this notification, you can help all Steemit users. Learn how here!