Chart Basics 101 part 2, The EMA 8- the Trendline
As we see the chart for June 21, 2017, we can see sellers emotions just by looking at the chart. The red candle signified a sell off or a pullback. Another key point to look at is where the candle finished the day. As long as it finishes above the EMA 8 trend line the trend is still upward. The characteristic of anything traded on the stock exchanges and the cryptocurrency markets is that they all follow the EMA 8.
If you look back through the history of any stock of even Bitcoin, you will see this truth in every chart. The growth trend will continue to move as long as the candle finishes above the EMA 8. Once the candle closes BELOW the EMA 8, you will have to watch for confirmation of a bear trend about to begin or pullback. At times, there are just corrections or plain old emotional traders running to the hills scared. This market is no different than the stock market or Las Vegas. Scared money never wins.
The biggest problem I faced and see the majority of traders is their emotions as I said yesterday. Fear and worry about the performance of whatever your are holding causes you to make bad decisions. When you see the price dip during the trading day, you panic and sell. Here is what happens. The one who controls their emotions has a plan and stick to it. He knows before the day begins where to sell and where to buy and the successful trader sticks to their plan. The emotional guy makes a plan but fails to adhere to it. After the successful trader sets his price to sell, the trade is initiated at that point where he planned. This begins to cause a drop in the price and Mr. Emotion starts to see this happening and begins to worry holding on too long until the price hits the low then he dumps. Meanwhile, Mr. "Got His Act Together", is about to buy back in at this point since all the scared emotional traders are bleeding to death.
Mr. Emotion sells and take a hit or a small profit. Minutes later he sees that the price is going back up now. Scratching his head, he is all bent and broken. Why did it go up when I sold? The question on many a trader's mind right? By the time Mr. Emotion got his guts up to sell and cut his losses, the market was already turning from a bottom and the guys who sold at the top are buying in at the bottom. So, Mr Emotion sits and tries to figure out what happened while the price is climbing higher and higher. Mr. Emotion then begins the worst thing a trader can possibly do, chase. Never chase a stock or a crypto. Learn the chart and know when to buy in. The cycle will continue to happen until the end of the world. People are too lazy to take the time to learn and trade properly.
Since I was Mr. Emotion for many years and lost much, I want to assist those Mr. Emotions out there and help become Mr. Successful. It is not rocket science and if I can do it, so can you. Again, I am not a finance advisor nor am I offering any buying tips. This is just passing along what hard lessons I have learned so you will not follow in my footsteps.
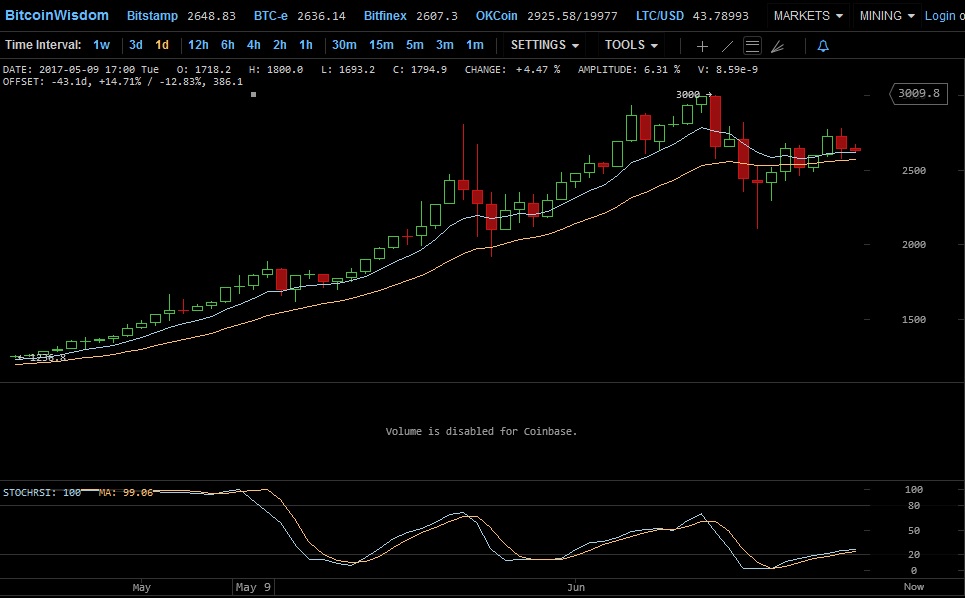
The EMA on today's chart is the light blue line on the top. Yesterday I marked on the chart that around 2800 was a point of resistance and it looked like it was. It got close to it but could not break through. I believe the red candle was just some selling and taking profits. That is the name of the game. Take profits whenever you can. But know when to do it. Guessing will not not get you far. You might get lucky for a time but it will expire. The red candle did not finish below the EMA 8 but it did dip below it yesterday. At the time of this writing, the red candle is riding on the EMA 8. If it continues to ride it and not finish below the EMA for the day all should be fine. I believe what we are seeing is some fear traders. Mr. Emotion is all over the place. They saw some selling and paranoia takes over and they feel "I have to get out now before it's too late." Wrong attitude!
This could be some consolidation taking place but it does not look like a reversal. The Stochastic chart below still looks okay in a bull trend. Not huge but it is moving up. As I said there are so many trading now and the majority are the Mr. Emotion guys. remember that. I want to reach out and help those guys. As long as it stays above the EMA 8 all is good.
Take some time to look at how the EMA 8 works. Learn charts, at least the basics. It will allow you to sleep better and become a wiser trader. Knowing what is going on and what others are doing allows you to get in and out at the right points. Exit and Entry strategies are the keys to successful trading. Become Mr. Successful and let's put Mr. Emotion away for good.
All the BEST!