[Technical Indicators] - Crypto Academy / S4W2- Homework Post for Prof. @reminiscence01
Hello folks,
I am back with yet another task which has taken me a bit deeper into the crypto world. Learning tricks of the trade is all one needs to do, to taste the success. Thanks to all the organisers of Crypto Academy for creating learning opportunities for us . ..
a) In your own words, explain Technical indicators and why it is a good technical analysis tool.
The trading world is unexpected there is no guarantee of riches or ruins. It is the sole responsibility of the trader to show utmost caution while jumping to trade. Among other ways, technical indicators have been invented to track different phases of the market and present it to the people in an easy and understandable form.
Indicators convert a plethora of data into easily understandable shapes, however, they are not magic wands that can nudge traders to sure success, they only track the mood of the market by breaking down huge data into understandable forms. It is the responsibility of the trader to make a proper analysis of the indicators and decide accordingly. Moreover, indicators have to be read as per the personal situations of the traders, it doesn't hold the same meaning for every type of trade.
- It is a good technical analysis tool because it helps traders to easily comprehend the otherwise complicated data and therefore makes trading easy.
- It gives information about the past, keeps updated about the present and hints about the future which is so beneficial for trading.
b) Are technical indicators good for cryptocurrency analysis?
The Crypto world is the sea that cannot be easily sailed through. If you go blindfolded you can sink or sometimes waves can take you to the shore of success. As already said there is no guarantee of riches. Technical indicators act as life jackets that keep traders afloat. The proper use of technical indicators and the correct analysis can make the traders see jaw-dropping trading opportunities. In other words, technical indicators help traders to gauge the market and trade accordingly.
With the help of technical indicators, traders are saved from the burden of surfing through huge data and can make easy choices of entry and exit in/from the market.
Technical indicators keep track of all the crypto currencies and better analysis of the imprints left by technical indicators help traders to invest in assets that are likely to see a bullish trend.
Technical indicators help traders maximise profits and minimise losses.
Considering this, We can say technical indicators are good for crypto currency analysis.
c) Illustrate how to add indicators on the chart and also how to configure them:
Adding and configuring indicators is an easy process illustrated with the help of the following pictures :
In picture, A I have selected the USDT/USD A and then I clicked on sign fx Indicators *B, the result as shown in Picture B followed.
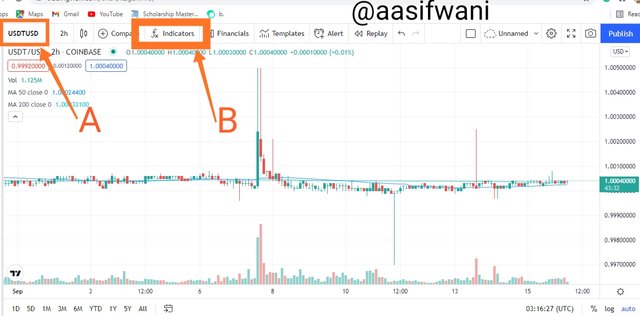
Picture A
In Picture B I searched the indicators of my choice in search bar C and the list of indicators appeared D after that I added 3 indicators including 2 MA's and one BB as shown in Picture C
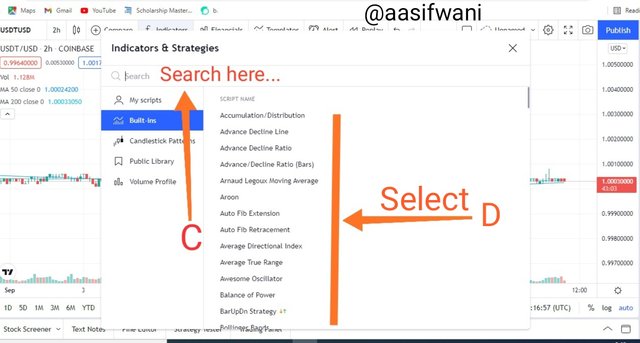
Picture B
In the picture C the options of indicators i added appear on the left side E and I click on one of the indicators and the setting sign pops up F
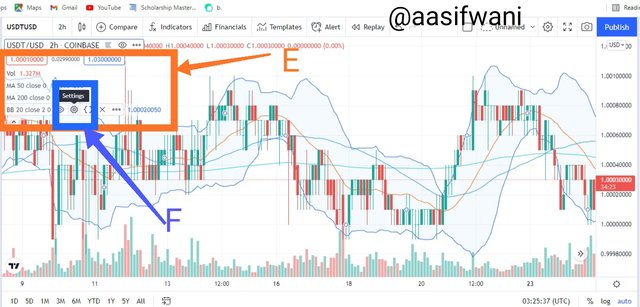
Picture C
I then click on setting F and the result as shown in Picture D and E appears.
Now I can change the colour, style and visibility of the indicators and make other changes according to my convenience.
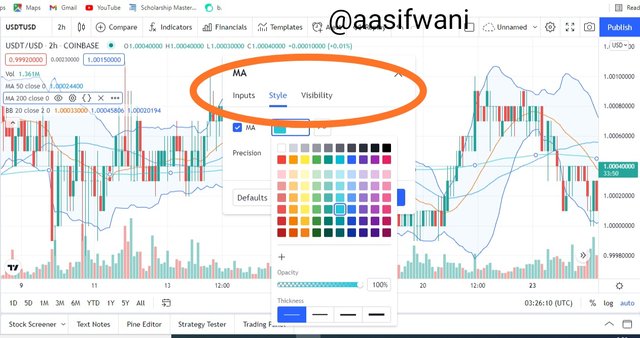
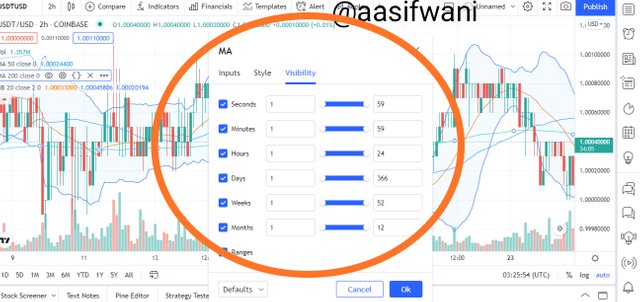
Picture D&E
a) Explain the different categories of Technical indicators and give an example of each category. Also, show the indicators used as an example on your chart:
BOLL, MACD and RSI Indicators used: BTC/USDT
Technical indicators belong to different families or groups, some of the groups are discussed hereinafter:
Trend Based Indicators
Trend-based indicators follow the direction in which the market is going. In trends, the market can either shoot or plummet and in both cases trend-based indicators track the market and leave traces for traders. Since most of the traders prefer to trade in trends trend-based indicators play a vital role for the traders to make successful trades. What is required is the proper understanding of indicators that is the case with other indicators too.
In the picture shown I am using one of the trends based indicators Moving Average (Exponential) for the BTC/USDT graph.
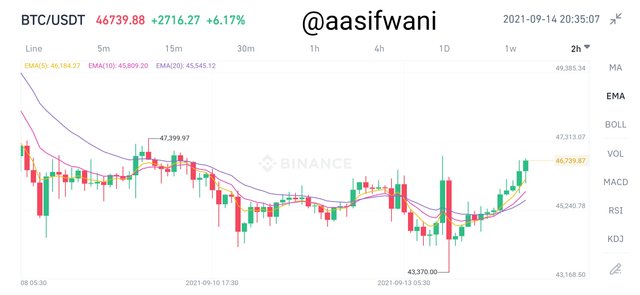
EMA Indicator: ETH/BTC
Volatility Based Indicators
Extreme volatility in the markets is only a matter of time. Following any event, markets can become highly volatile and create good trading opportunities. It can also result in a huge loss if the market goes down. Volatility based indicators help traders to keep track of potential volatility in the market.
With the help of volatility-based indicators, traders can create very good trading opportunities and can save themselves from potential loss.
Bollinger Bands, Donchian Channel, Kalenter Channel, ATR and India VIX are some of the volatility-based indicators.
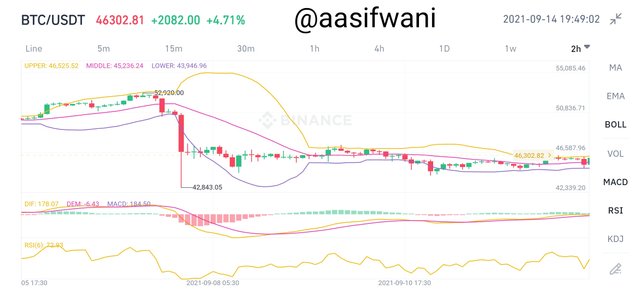
In the picture used below, I have used Bollinger Bands for BTC/USDT on the Binance app.
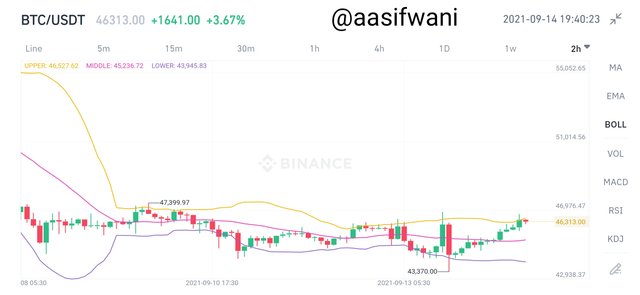
BOLL Indicator: BTC/USDT
Momentum Based Indicators
Momentum-based indicators are highly useful tools for traders, however, these indicators are rarely used in isolation as supplementing these indicators with the indicators of other category are more understandable. Momentum based indicators also called MOM Indicators show the momentum in price within a particular time. These are also called oscillators.
MOM points out the underpriced and overpriced moment in the price and invite the traders to make the trade depending on their choice. Traders who possess a particular asset prefer selling the assets at the time of overpricing while when prices go down some traders invest in the asset with the hope of a future rise in the price.
Following is the formula of momentum-based indicators:
MOM = (current closing price ÷ closing price of a previous period) x 100
In the given picture I have used MACD for BTC/USDT chart in a Binance app.
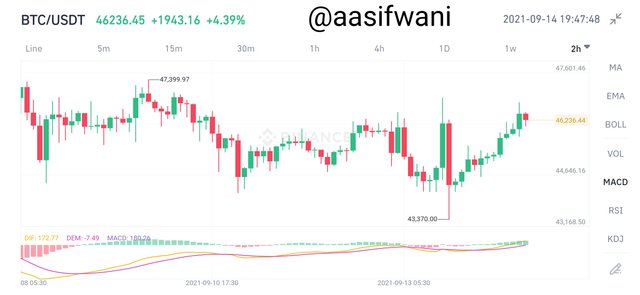
MACD Indicator: BTC/USDT
Briefly explain the reason why indicators are not advisable to be used as a standalone tool for technical analysis:
Indicators are not foolproof therefore we cannot expect 100% accuracy from them. When we say we cannot expect a cent per cent accuracy from the indicators it means there is a risk in relying solely on indicators for any trading. With the availability of options and ways to avoid the risk in trading, it is foolish to take the risk and invite loss that could be avoided. Moreover, there is no guarantee that we will always analyse and use the indicators correctly which means every incorrect use of an indicator when used as the standalone tool will be a bad trade.
c) Explain how an investor can increase the success rate of a technical indicator signal.
There are different types of indicators and some of the indicators perform similar functions. If we apply indicators that perform similar actions to a single chart, it will double count information and result in misinformation, this is a common mistake which is called: Multicollinearity.
To ensure the success rate of the signal created by an indicator we must study the functions of all the indicators and use them properly. While using multiple indicators we should use the indicators that aid each other rather than performing the same action.
- We must keep the charts readable for that we should make a proper selection of colours that could be easily grasped and signal that is provided by the indicators is easily digested by the trader.
- We must avoid overburdening the chart with a lot of indicators that will create an information overload and will take off our attention certain important signals.
Cc: Prof. @reminiscence01
Hello @aasifwani , I’m glad you participated in the 2nd week Season 4 of the Beginner’s class at the Steemit Crypto Academy. Your grades in this task are as follows:
Recommendation / Feedback:
Thank you for completing your homework task.
Thank you professor!
Hi, @aasifwani,
Thank you for your contribution to the Steem ecosystem.
Please consider voting for our witness, setting us as a proxy,
or delegate to @ecosynthesizer to earn 100% of the curation rewards!
3000SP | 4000SP | 5000SP | 10000SP | 100000SP