[ Leverage With Derivatives Trading Using 5 Min Chart ]-Steemit Crypto Academy | S6W1 | Homework Post for Prof. @reddileep
My understanding of Leverage Trading
Our overtures towards reaching overnight richness are perennial and we pick every opportunity that promises double benefits. Leverage trading falls in that category of multiplying your profits up to 100x. But no matter how lucrative it may sound there is always a looming risk of losing your invested capital if the market goes against our trade ---- short or long. That is the reason beginners are not advised to do this trading.
I learnt leverage trading in January 2022 and lost more than 30,000 INR in less than a week. I lost only because I didn't know how to analyse charts and where to make my entry. I soo much wish that Prof. @reddileep 's lecture had come before I jumped into leverage trading, unarmed and ignorant.
Leverage trading allows traders to borrow assets for 100 times more than the capital they own. The extra buying power is offered by exchanges/brokers for they supply their funds to make a trader earn more. But the loss does not exceed the principal investment made by the trader if one is into *isolated margin mode.
That is to say: if you have invested 100 USDT and the trade goes against the position your trade will close when the loss reaches 100 USDT - It is called liquidation.
If a trader supplies more funds or selects cross margin mode say 20 more USDT the trader will not be liquidated at 100 but 120. The cross margin mode affects the funds other than used in leverage trading and the trader stays in the trade as long he has extra funds.
Advantages
As already referred to above, the leverage trading empowers those who have limited resorces to trade with. The resource capacity -- say 100 USD -- of a trader could be enhanced upto 100x in leverage trading. That is to say trader having the capital 100 usd can trade for 10000 USD by opening a position of long/short trade.
Interestingly the exchanges charge diminutive fee on this. Moreover, if the trade goes against ones position the trader can supply more funds to stay in the trade and after the market starts going into the position one has taken -- long or short , the profit starts raining. Or, in other case trader can close thr position midway to minimize the loss, if he apprehends.
The profit can be accumulated in the short span of time, unlike in spot trading, where it takes a long time for the profit to come traders way.
Leverage trading also allows traders to earn even when the market is going down. In that case traders take short/sell position as opposite to long/buy position.
It also allow traders to take multiple positions in the market simultaneously that means a trader can take position in different assets at the same time. If he suffers loss in one asset the trade in other asset may go well and compensate his loss.
Disadvantages
- The word RISK is the first thing that hits my mind when i think about disadvantages of the leverage trading . The pace with wich funds can wither away is way grater than in spot trading. If the trader has taken 10x position, the loss would be 10 times grater than the spot trading.
- If one tries to stay in trade for longer than 8 hours or so to wait for the market to go in the position trader has taken the extra fee is charged.
- If the trader has no funds to supply when his principal amount is about to exhaust he gets liquidated.
Basic Indicators that are pressed in use for Leveraged Trading:
Having already talked about the risk involved in leverage trading we cannot afford to trade based on faith. There must be something to suggest us where the price is going -- up or down: Here is when traders need Indicators. They show us trends, shifts and mood of the market.
Following are some of the indicators commonly used:
Parabolic SAR
This indicator uses dots to represent price movement. The market movements trigger the indicator and produce dots above or below the price strain. When the dots appear on the upper side that is signal for the price decline and when the dots appear below the price that is taken as signal for possible hike in price. This indicator is sophisticated than the below discussed indicators.
.png)
Exponential Moving Average (EMA]
EMA is believed to be the improved version of plane Moving Average . This indicator is also used to ideantify the price movements and its accuracy can be incentivised when other indicators are coupled with.
The price acton, using this indicator, is usually identified by looking at the price: if the price is seen floating above the EMA that is taken as a signal for upward price action and when the price dives below the EMA that signals the possibility of price dip.
For the sake of this task, I customised the indicator by selecting the length of 200 day only. Only because of this customisation there is a single line of 200 day. Otherwise EMA indicator has three lines.
.png)
Relative Strength Index (RSI)
This exposes a trader to the overbought and oversold price zones of an asset. It is divided into different zones and the price line enters into each zone depending on the price movement.
If the line has reached above 70 zone that suggests the price has already gone high and trend can break out of exhaustion, similarly if the price dips below 30 zone that is taken as trend is tired of going further down and there is possibility of reversal. Zone 50 is a center stage and traders take into account whether RSI line is below or above the 50 zone. That psychologically motivates them to do short or long trade. Ofcourse after they analyse other indicators.
For the sake of this task I have again customised the indicator by ticking off some unnecessary branches such as RSI based MA, Upper/Lower Bollinger Band, RSI Upper/Lower Band.
.png)
Please note the indicators can be customised by clicking on the "setting icon" and then by exploring inputs, style and visibility options.
Leverage Trading Strategies/practices
There must be a trading strategies for the leverage trade to work in our favour. I demonstrate what strategies can add to the success rate of trading.
I select 5 min chart and then I switch to Heikin Ashi candle to increase lucidity of market movement. Pic L1.
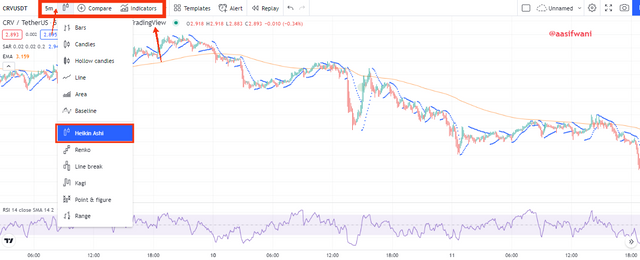
L1
I then demonstrate the strategy for long/buy trade vide the pic L2 wherein I analyse EMA, Parabolic SAR and RSI.
Seeing EMI floating over the price; parabolic SAR dots forming beneath the market price; and RSI swiming in the oversold waters formed a perfect signal for upward market move.
Based on this, I picked 3 spots viz. entry, stop loss and book profit. After making up the mind, we have to wait for indicators to trigger our execution. For example when price goes up and indicators show contrary position the strategy is executed.
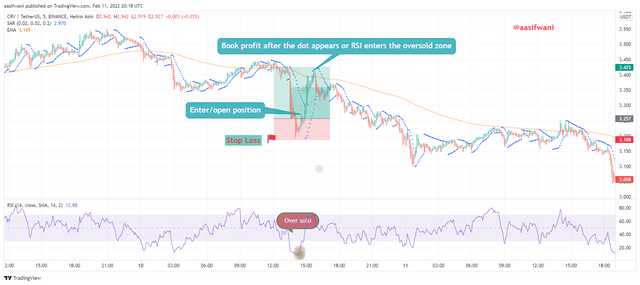
L2
To perform sell short I will again look at indicators and if I see Parabolic SAR dots forming below the price, RSI indicator in over bought zone and EMA 200 budging below the price I'll make a mind for sell trade.
Picture L3 demonstrates the what action is to be taken at what stage. We have to wait for indicators to trigger action and execute trade.
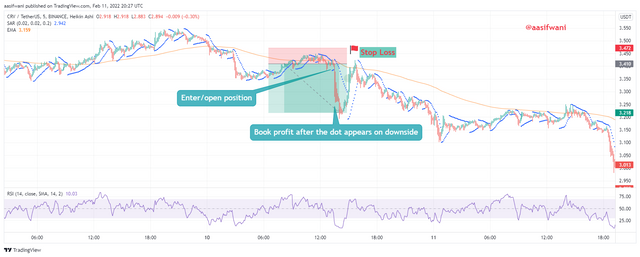
L3
Executing Leverage Trade
I have chosen Binance to execute the leverage trading as required by this task.
After loading the chart with 5 min, Parabolic SAR, EMA, and RSI I selected CRV/USDT pair.
- I waited for the price to recover and took my position as demonstrated in picture T1
T1
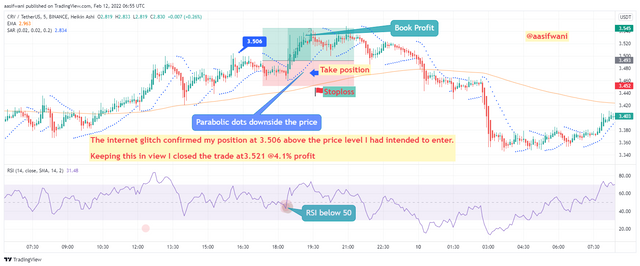
I looked at each indicator including EMA which was floating above the price, Parabolic SAR had started sprinkling the dots below the priceline and the RSI indicator was struggling below 50 range.
As the things got clearer, I took a position and entered trade -- long one.
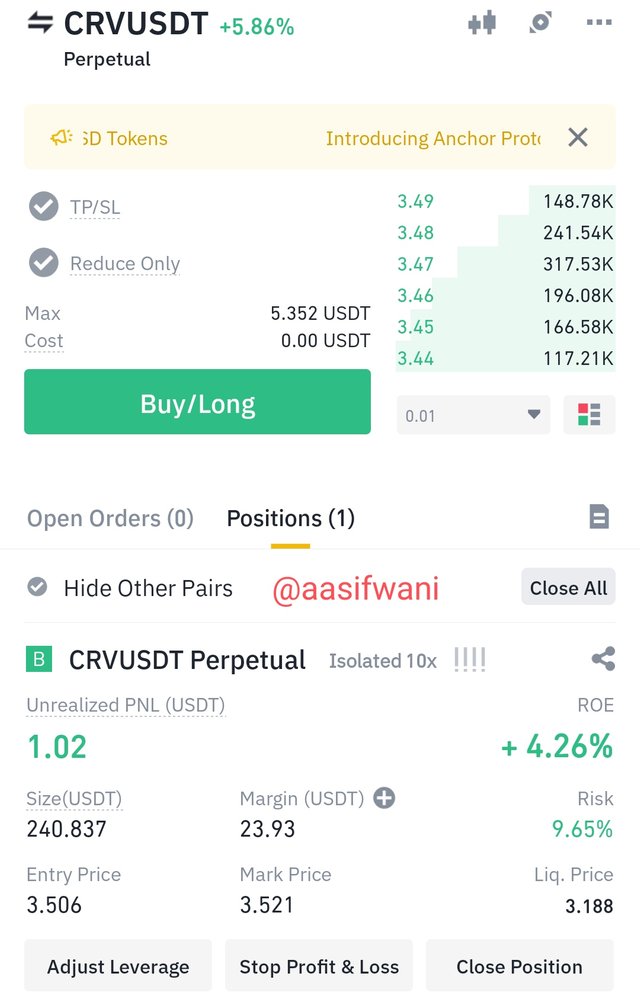
T2
Unfortunately, as I took the position my entry got delayed due to the internet glitch. This could have been avoided if I had taken limit order. In limit order the trades get executed at the price we have scheduled.
But, I entered the trade on market price and at the time my entry got through price had gone up. Still I exited the trade with 4% margin.
Picture T3 details out the trade history.
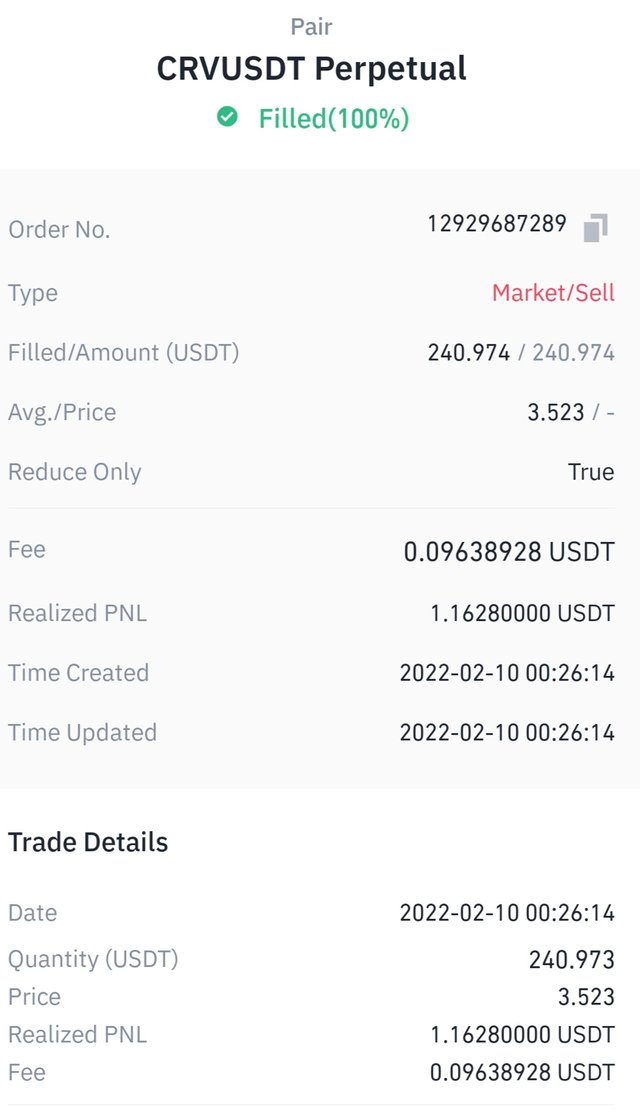
T3
Conclusion
I painstakingly worked on this task and explored almost every aspect and I am happy to state that this task has added exponentially to my skillset. Given my bitter tryst with leverage trading that cost me more than 30K, I perform this task quite emotionally and I am happy to experience this task as it was very insightful.
Note:-
I have not been active on steemit for almost 2 months now, due to my tight schedule and the evnt that unfolded in BOI community, but I have powered up all the delegator rewards that I got and I have been curating the quality content in different communities thereby generating curation rewards. It is because of this season of Crypto academy, particularly because of this task that again motivated me spare all my time for steemit. I am looking forward to partaking in / learning from this season with renewed energy.